- Adding the debugger keyword in your source file
- Using Visual Studio Code for debugging
- Using the remote Node.js debugging feature
- References
Adding the debugger keyword in your source file
When a JavaScript application is executed through a debugger, execution halts when the debugger keyword is encountered, and control is passed to the developer.
For example, in your index.ts file:
1 | import { sum } from "./calc.js"; |
There will be no change in the output when the code is executed because Node.js ignores the debugger keyword by default.
Using Visual Studio Code for debugging
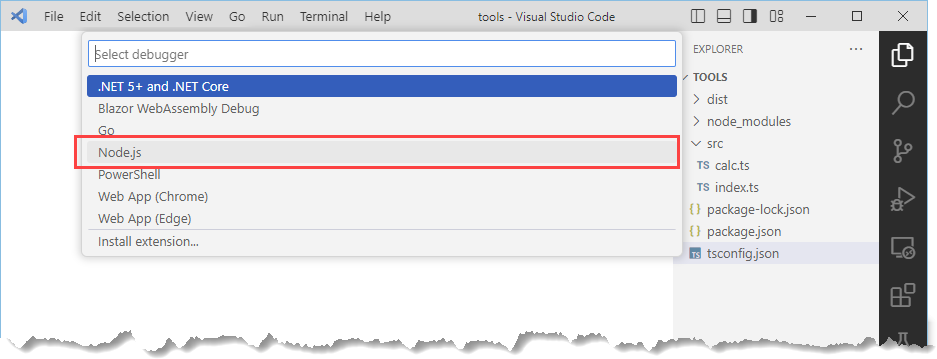
To set up the configuration for debugging, select Add Configuration from the Run menu and select Node.js from the list of environments when prompted, as shown in:
The editor will create a .vscode folder in the project and add to it a file called launch.json, which is used to configure the debugger. Change the value of the program property so that the debugger executes the JavaScript code, as
shown below:
1 | { |
Save the changes to the launch.json file and select Start Debugging from the Run menu. Visual Studio Code will execute the index.js file under the
control of the Node.js debugger. Execution will continue as normal until the debugger statement is reached, at which point execution halts and control is transferred to the debugging pop-up, as shown below:
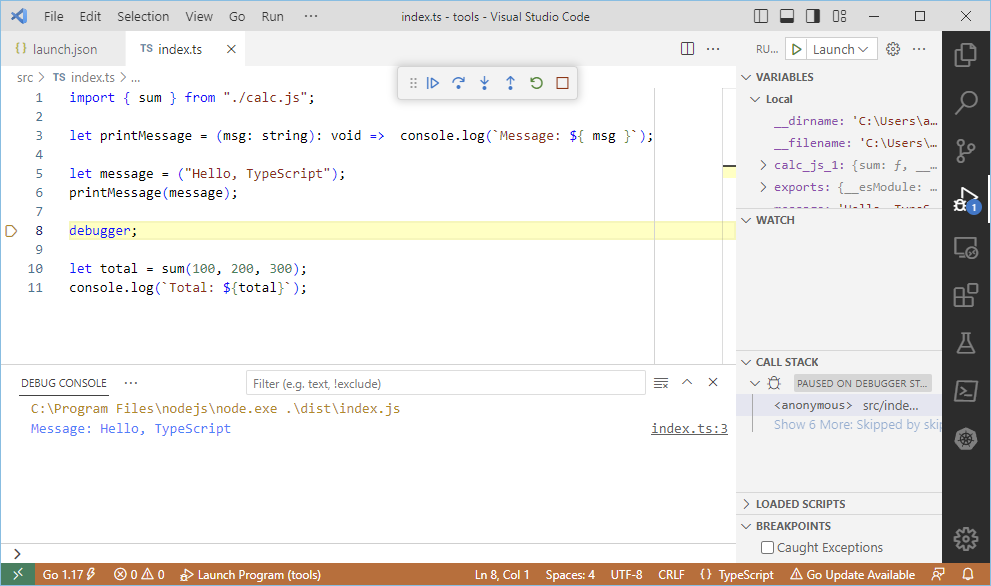
The state of the application is displayed in the sidebar, showing the variables that are set at the point that execution was halted. A standard set of debugging features is available, including setting watches, stepping into and over statements, and resuming execution. The Debug Console window allows JavaScript statements to be executed in the context of the application so that entering a variable name and pressing Return, for example, will return the value assigned to that variable.
Using the remote Node.js debugging feature
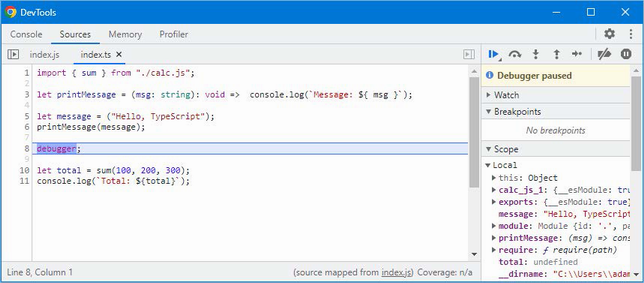
The integrated Node.js debugger is useful but awkward to use. The same features can be used remotely using the Google Chrome developer tools feature. First, start Node.js by running the command shown below:
1 | node --inspect-brk dist/index.js |
The inspect-brk argument starts the debugger and halts execution immediately. This is required for the example application because it runs and then exits. For applications that start and then enter an indefinite loop, such as a web server, the inspect argument can be used. When it starts, Node.js will produce a message like this:
1 | Debugger listening on ws://127.0.0.1:9229/e3cf5393-23c8-4393-99a1 |
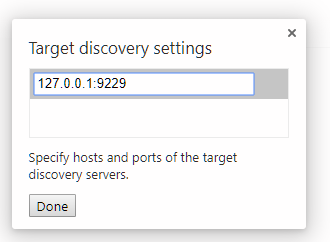
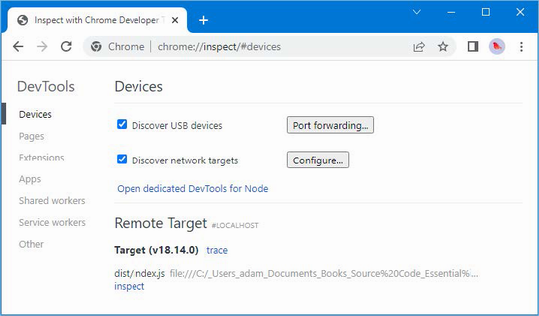
The URL in the output is used to connect to the debugger and take control of execution. Open a new Chrome window and navigate to chrome://inspect. Click the Configure button and add the IP address and port from the URL from the previous message. For my machine, this is 127.0.0.1:9229, as shown below:
Click the Done button and wait a moment while Chrome locates the Node.js runtime.
Once it has been located, it will appear in the Remote Target list, as shown below:
Click the inspect link to open a new Chrome developer tools window that is connected to the Node.js runtime. Control of execution is handled by the standard developer tool buttons, and resuming execution will let the runtime proceed until the debugger statement is reached. The initial view of the code in the debugger window will be of the JavaScript code, but the source maps will be used once execution resumes, as shown below: